Task and zones
The declared task drawn with start line, turnpoint sectors and cylinders, against the track you actually flew.
Drop in an IGC file and read the whole flight: declared task and zones, barogram over terrain, vario, ground and air speed, thermals, glides, circling and estimated wind.
Open a sample report ↗ PDFThe original IGC and report remain private to this browser session until removed or the session expires.
Detected in 45,542 accepted IGC files across 401 flying days.
1,696 configurations, 778 of them with a calculated model polar.
Alongside 20,878 airspaces covering 92 countries.
Seven screens, one place. Flight analysis, thermal maps, the polar database and live traffic.
Every original IGC fix is kept in the analysis — nothing is thinned out to make the charts draw faster.
The declared task drawn with start line, turnpoint sectors and cylinders, against the track you actually flew.
Pressure altitude against ground elevation, with terrain context throughout the flight.
Barometric vario for the whole flight, with each climb measured and timed.
Ground speed and estimated true airspeed, with wind context along the flight.
Every detected climb, with average lift, height gain and time spent.
Each glide with its distance along the track, speed and achieved L/D.
Turn by turn: radius, estimated bank angle, direction and drift, shown as ground track or air mass.
A velocity-circle fit during complete turns, plus a wind profile in 200 m pressure-altitude bands.
Thermals, glides and failed attempts laid out on one timeline you can zoom into.
The same flight, at two depths. Choose the view that fits your debrief.
Pilot, glider and task, the map, the barogram and the headline numbers — the version you send to a friend after a good day.
Everything above plus circling detail, the wind profile, glide and climb statistics and the phase timeline — the version you go through with a coach.
View the sample PDF ↗Both export to PDF in A4 or Legal. Explore the charts in detail and save them as PNG.
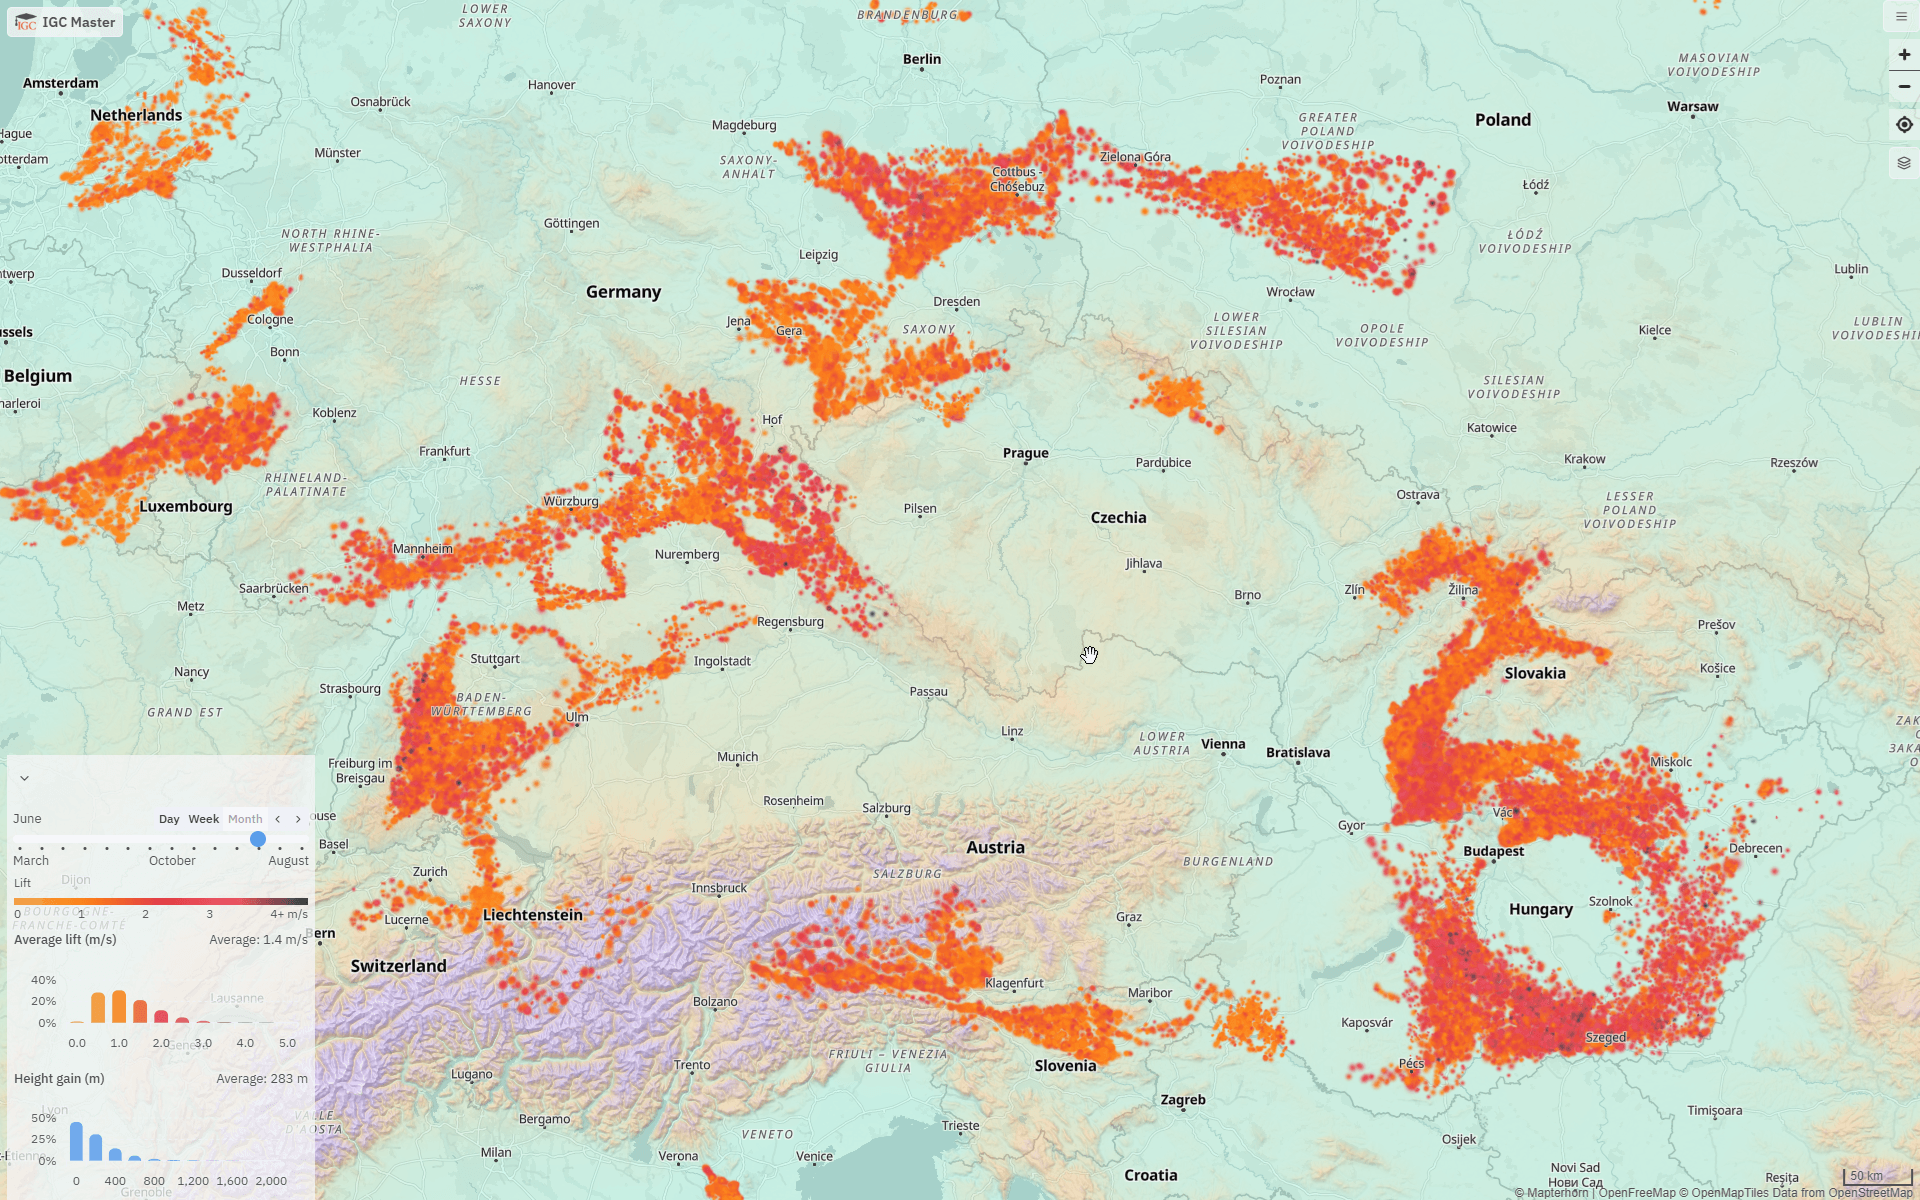
Explore detected climbs from recorded IGC flights. Filter by day, week or month; colour is average lift, and the histograms show climb rate and height gain for the current view.
Open the thermal map →
1,397 sailplane records and 1,696 configurations, 778 of them with a calculated model polar. Put up to five aircraft on the same axes: sink rate, glide ratio and final glide.
Compare polars →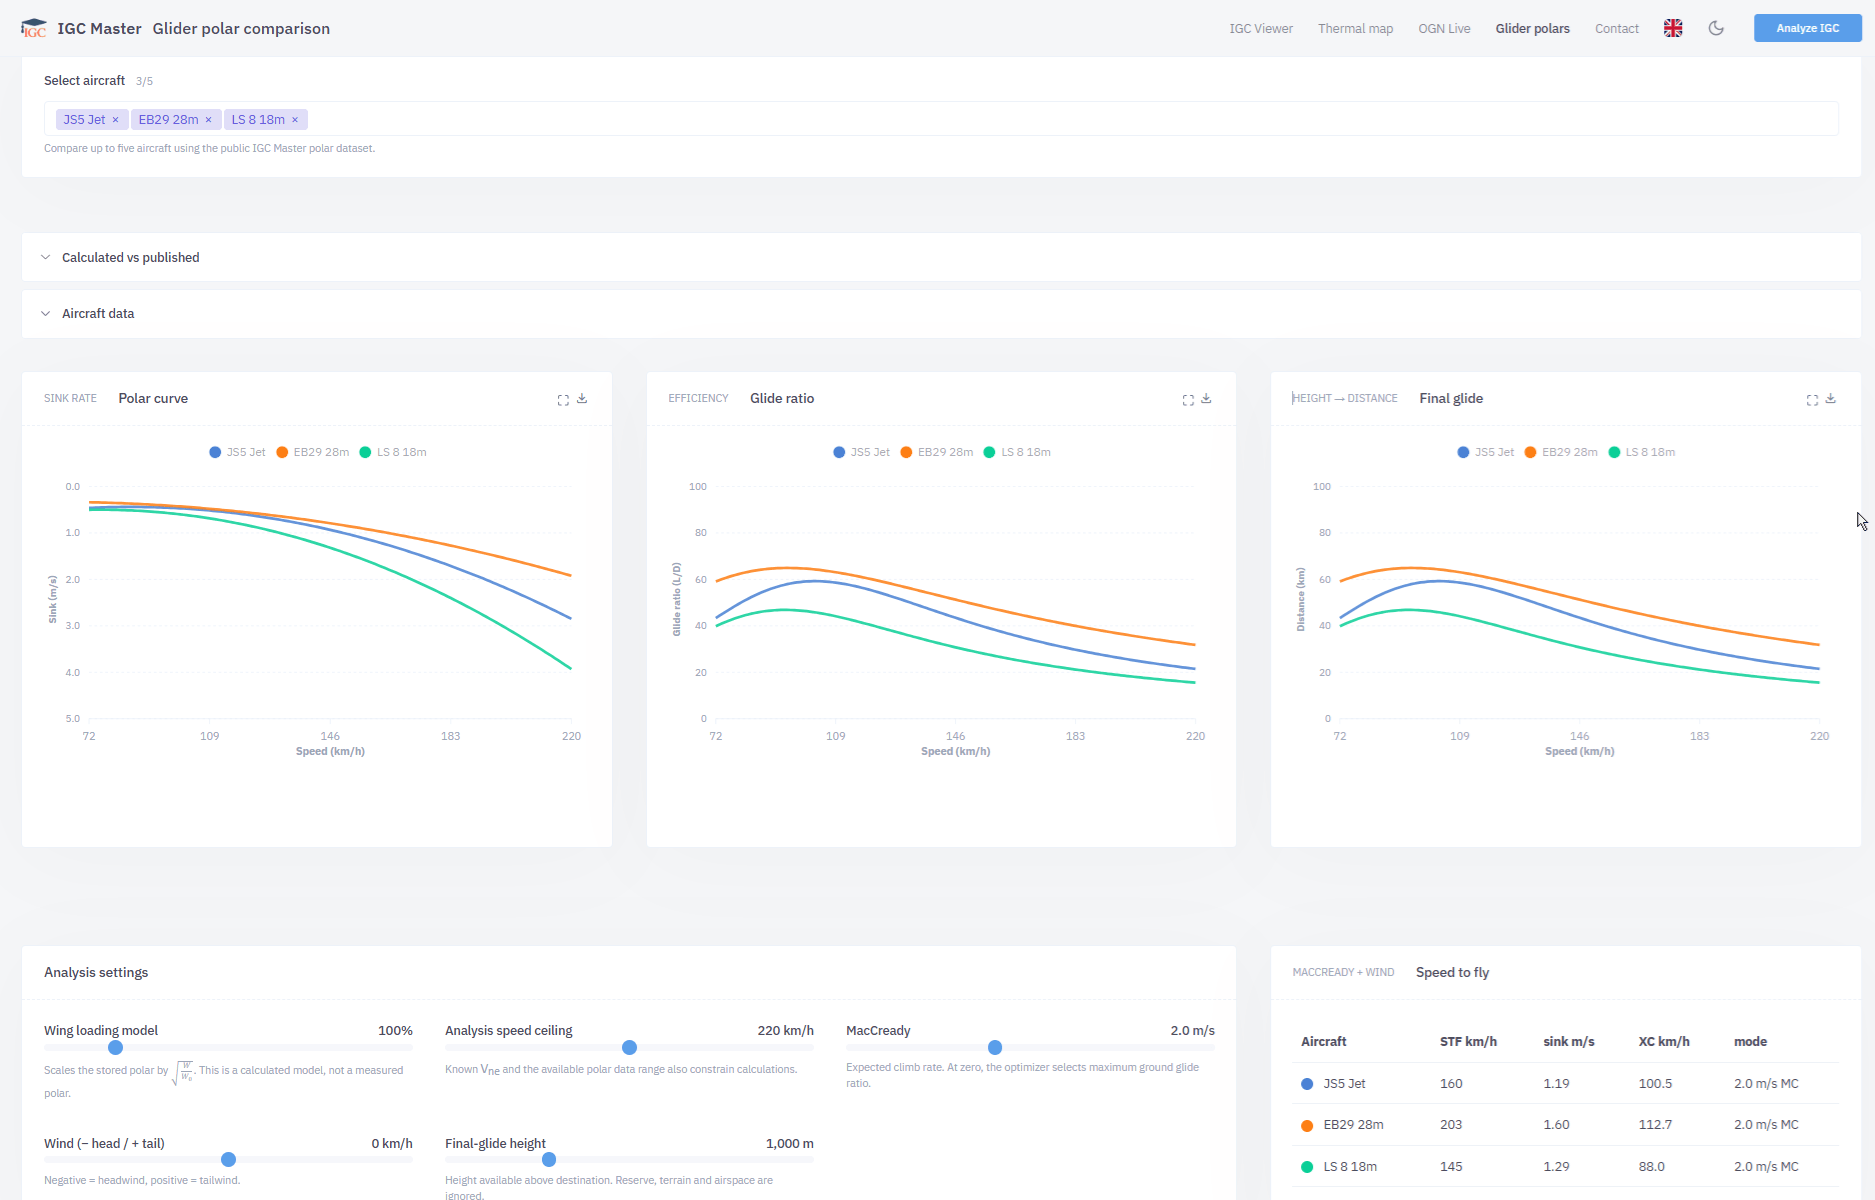
Live OGN traffic with altitude, vario, ground speed and track, a timeline you can scrub back through, and terrain and airspace layers. Follow competitions with their tasks, classes and contestants.
Open OGN Live →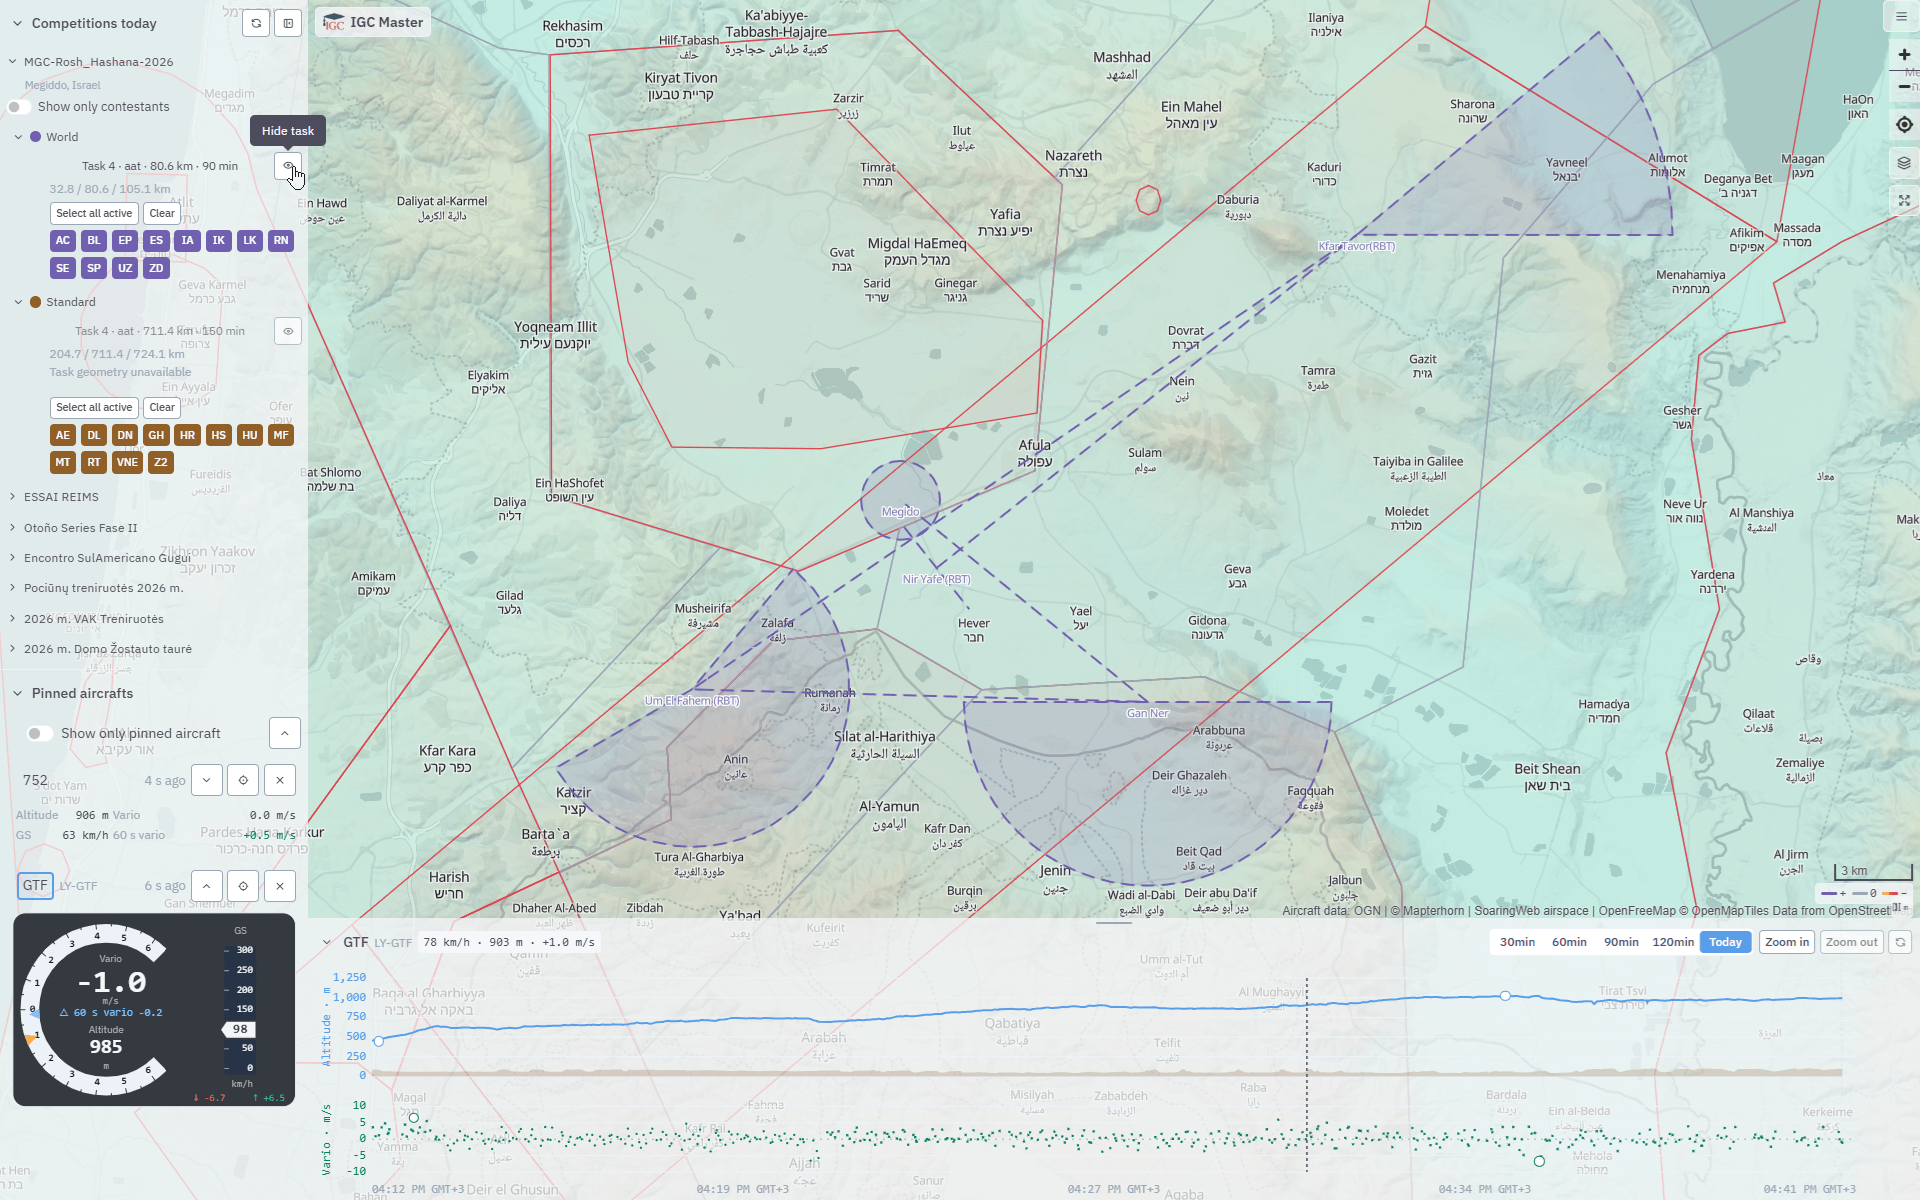
Drop the IGC straight from the logger, SeeYou or your club’s archive.
Confirm the aircraft details, start the analysis, then explore the map and charts.
Export the report as an A4 or Legal PDF, or save a single chart as PNG.
Nothing to upload yet? Take a look at the sample report first.